Here’s a quick fun activity! Name five social media KPIs without scrolling down!
If you’re able to do it, give a pat on your back – social media tracking is going to be super easy for you. If you weren’t able to, well, this read will help fix that for you!
Industry leaders and social media experts say that “Social Tracking” is the most essential part of your social media strategy! And we totally agree with this!
From Twitter to Tik-Tok, the global usage of social media has skyrocketed to 3.6 billion. And it is estimated that by 2025, there will be 4.4 billion users across social media platforms.
That’s quite a number, right?
While it is understood that not everyone on social media is interacting with brands, a significant portion of people use social media to discover and research new products & brands.
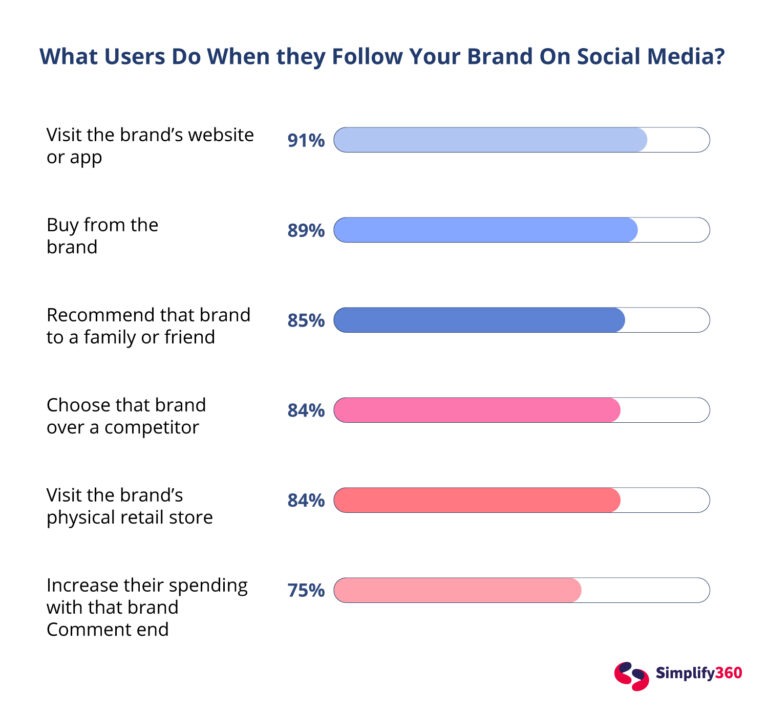
In fact, a recent study asked consumers what they do once they follow a brand on social media. Trust us, the results will make you want to go ramp up your social media game right now.
With this much happening around (at least a half of it around your brand), don’t you think it’s time you put a couple of social media engagement metrics to use?
You not only know how people are interacting with your brand but it also helps you make major business decisions! That said, let’s get on with the read!
What Are the Categories of Social Media KPIs for Social Tracking?
Yes, there are different types of social media performance KPIs you can use to analyze and boost your social media. And each type serves a different purpose! If you are a small business, you can choose to prioritize certain social media KPIs. However, the value of the insights you get will be limited.
1. Audience Insights
Social media tracking is essential to understand your audience demographics.
Monitoring audience metrics allows you to see if and how your target audience is engaging with your content. Your audience insights can help you determine if your social media audience is aligned across channels.
Let’s take for example your company makes pop-culture related merchandise, from phone cases to clothing. Your target audience would be probably millennial and gen-z women and men. The age range would approximately be between 18-35. However, compared to your Instagram page, your Facebook audience are mostly 45-55 year old men. This means your audience is not aligned.
Some influencers and organizations invest in bots to engage with their content. But this is just a temporary boost because when social media channels detect a high level of bot engagement with your content and account, they may reprimand you.
2. Content Engagement Insights
Tracking content engagement metrics will help you to examine how your audience engages with content you share on social media and identify specific patterns. Suppose 65% of your posts are images, 25% are videos and 10% are reels on Instagram, analyse how your social media content is performing based on content formats (in most of the cases, Video wins).
Or you can simply take a look at what kind of content is performing well.
A good content strategy rule to follow is the 70/30 rule. Approximately, 30% of your posts can be original content promoting your brand or products and the other 70% needs to be industry related, trend-jacking, topical or reposted content from creators and influencers.
You can conveniently analyze the performance of original content vs. reposted content created by others. You can also break it down even further and see which visuals, colors, CTA, etc. is working best for you. A lot of A/B testing can be also be done.
3. Competitor Insights
Social media tracking isn’t just for your brand and your customers. It’s also to keep an eye on what your competitors are doing. Observing what your competitors are posting can help you improve your own social media marketing.
However, do not consider your observations as rules to follow.
You can’t be sure of how well your competitors’ social media campaigns are contributing to their overall goals and if these strategies would work for your company. Rather, use the research and data you collect to innovate new creative ideas and strategies to test.
With a platform like Simplify360, you can track all your competitors across channels and compare your performance without having to follow and constantly check your competitors pages and performance.
4. Listening Insights
Social listening helps you do more than just track mentions across social media. Explore what your audience is saying about your brand on social media and track the sentiments of such conversations.
Tracking and analysing online conversations can help you determine how to reply as a brand, resolve customer issues and express gratitude when appropriate.
Social Listening can help you analyse conversations, trends and buzz in your industry and put your findings into action.
Simplify360’s social listening platform empowers brands by providing comprehensive omnichannel insights on post and campaign performance, audience sentiment and reaction.
Now that you know the different categories of KPIs you should monitor, let’s get into the specific metrics and KPIs that will help you analyze your performance within these categories.
10 Important Social Media KPIs You Should Consider Using
Whilst there are a number of social media KPIs around, we’ve come up with the most important ones here. Carefully studying and implementing these can help you gain a complete understanding of how your brand’s social media strategy is satisfying performance goals.
Here’s the first social media engagement metric for you!
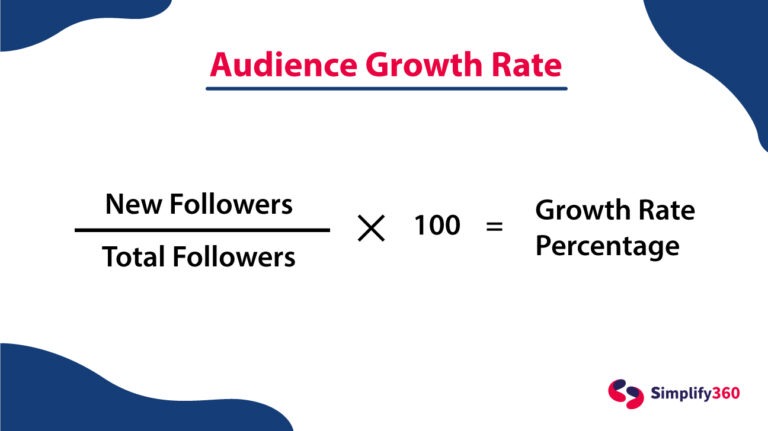
1. Audience Growth Rate
Why this social media KPI first? We’ll tell you!
The “audience factor” is the key to any brand growth. And you want to ensure that you’re acquiring followers rather than losing them. The audience growth rate shows how the number of followers changes over time.
Benchmark your audience on each social media channel and track the growth of those numbers on a daily, weekly, monthly basis for evaluating the rate at which you’re gaining new followers.
Pro Tip: You might see that you are gaining a significant number of followers but simultaneously losing followers regularly, especially on Facebook and Twitter. And if this turns into a trend, this might be due to Facebook & Twitter algorithms removing fake and inactive followers from their respective platforms.
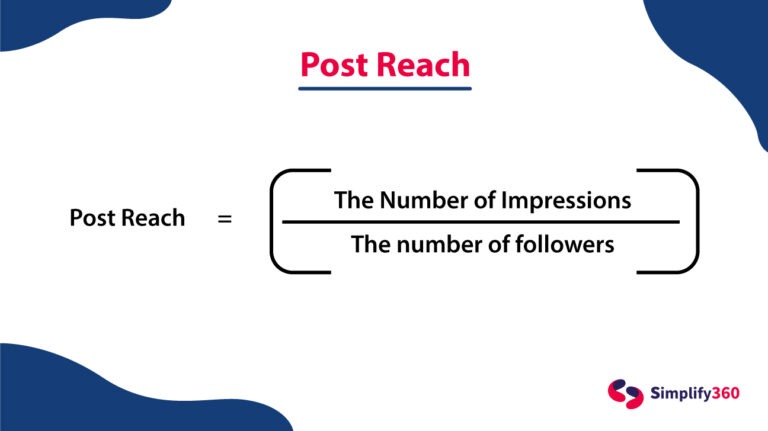
2. Post Reach
What good is it when you constantly post without knowing how your posts are performing?
This social media KPI, “post reach” tells you the number of unique accounts that have seen your post. Regardless of the number of times a single account has viewed the same post, the post’s reach will still be one.
Post reach is similar to post impression; however, your post reach is likely lower than your post impressions. This is because post impressions take into account every view or interaction with the post, even if it is the same account.
Post reach will give you a clear understanding of what content is working. For example, if you see reach is higher for carousel posts, try creating more carousel posts for the next few weeks and see if the reach increases.
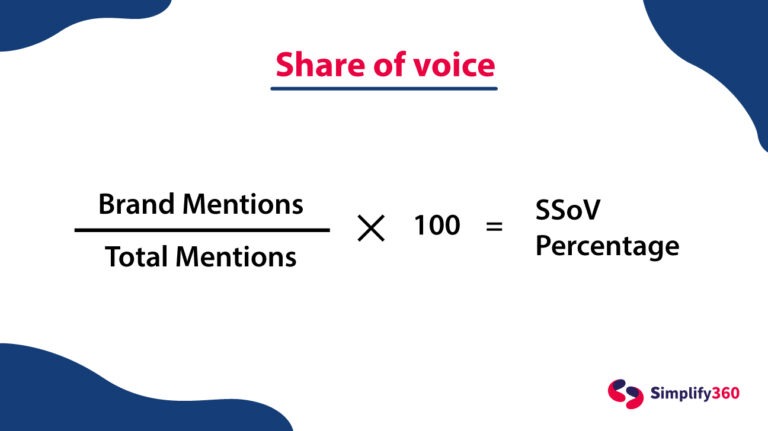
3. Share of Voice
Share of voice measures your online visibility when compared to your competitors. You’ll need to decide which keywords, hashtags, or categories you want to concentrate on to track this metric.
It reflects your brand’s relevance in your industry. Social listening tools like Simplify360 can help you track your own and your competitors’ mentions in a particular period of time.
4. Customer Sentiment
Customer sentiment is a metric that indicates how customers feel about your brand. It gives you insight into a customer’s overall emotions towards your brand after interacting with you at a specific point in the customer journey – it could be positive, negative, or neutral.
Customer sentiment is a qualitative measure of a customer’s experience with your brand. It helps you to understand why your customers feel the way they do about your brand and, more crucially, why they are satisfied or dissatisfied with your brand.
5. Comments
Comments could be on both posts and live streams. These can be tracked with most AI-powered platforms in their analytics section; you can break down data per post or tally for an overall number.
Comments are a strong indicator of an engaging post and is a much deeper engagement metric! When compared to likes, commenting takes much more effort for the user and they do it only when they are truly engaged. Now you also need to look at the sentiment behind the comment. If you are more often leaning towards “Where is my refund?” kind of comments (the negative ones), then you need to think about opting for Social Media Care.
The number of comments on your post can also help you determine if your social team requires additional resources to manage responses. You can conveniently monitor and respond to all customer comments across platforms with an omnichannel platform like Simplify360.
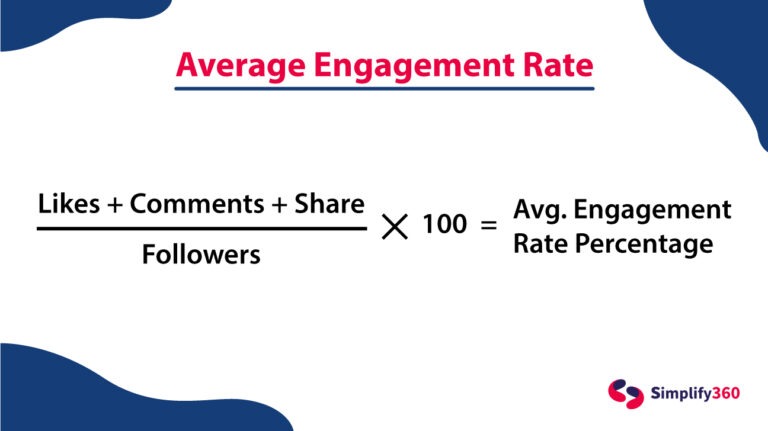
6. Average Engagement Rate
The average engagement rate divides the total number of followers on your social media channel by the total number of likes, comments, saves, and shares on a post. It is the best estimate of how engaging your post was. Generally 1-3% is a good average engagement rate and 3.5 – 6% is a high engagement rate.
This is the go to indicator for social media marketers, when it comes to social media content strategy.
Pro Tip: LinkedIn by default shows clicks as a part of engagement, thus boosting up the default Engagement Rate for Multiple Image Posts or Carousels. Make sure you deduct the number of clicks before calculating the original engagement rate.
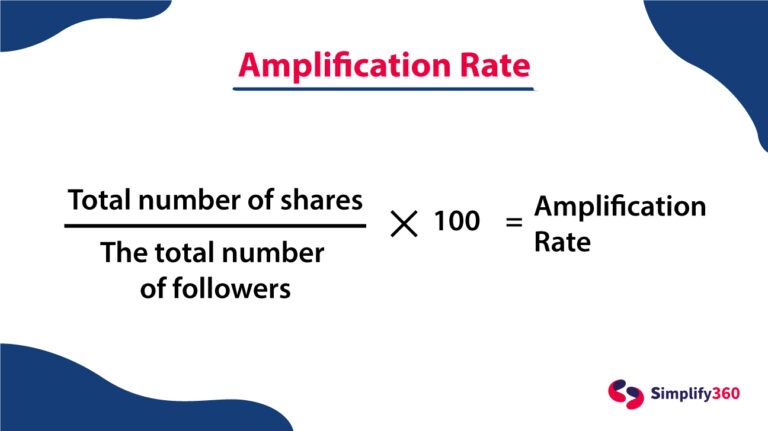
7. Amplification Rate
This is the number of times your followers share your posts with their followers. Shares and retweets are included in this metric, as well as repins and reposts.
Monitoring post and profile shares are a great way to gain insights into your social media engagement. It means your audience found your post so interesting that they had to forward it to someone, share it on their story or another platform. Shares are the best kind of engagement because it introduces your brand to new people.
A high amplification rate essentially indicates that your followers want to be connected with your brand.
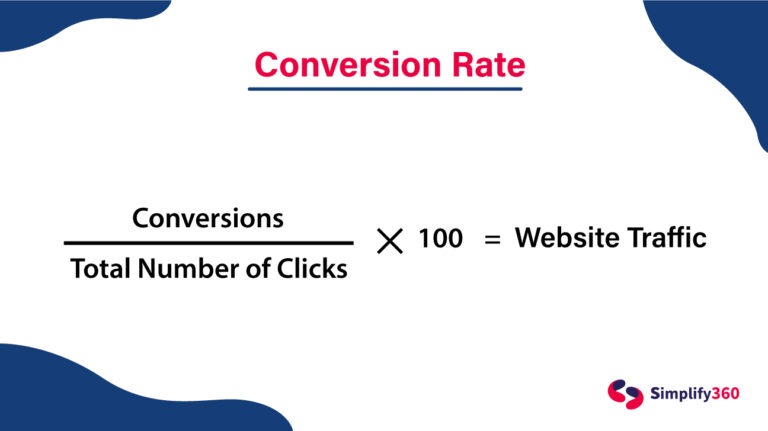
8. Website Traffic from Social Media and Conversion Rate
If you are not using Google Analytics yet, you need to get on it immediately.
Google analytics gives you deep insights about how your customers are navigating your website and is essential for tracking social media growth.
Once you visit your Google analytics, you can track the traffic to your website. Simply go under Acquisition, select Channels you can see how much traffic you are getting from Social Media.
This will give you an understanding of what the impact of Social Media is on your Website traffic.
Google Analytics Goals are important, you can create custom goals based on your objective. Goals can be Macro or Micro conversions aligned with your business objectives. Macro Conversions are when a user completes a purchase or submits a form as a lead. Micro conversions can vary from as simple as blog impressions or product page views to subscribing to your blog.
Conversion rate determines the percentage of users who have completed any specific goals that you created.
At the end of the day, all your marketing efforts should end up in conversions. And knowing what the conversation rate is even more important to ensure that your marketing efforts didn’t go in vain!
It is the best measure of how well your social media strategy is performing. Building trust with a customer takes time and effort. But there are numerous ways to increase leads through social media. They may not make a purchase from your brand the first time around, but when they eventually do, they will be identified as a customer.
9. New Users and Bounce Rate
Google analytics also gives you insights into the number of new users visiting your website from Social Media as well as other sources. New users measure the number of people who are visiting your website for the first time. The higher this number the better for your brand, this will mean that you have been able to attract new customers or potential customers from social media.
However, not everyone who comes across your social media post will click on the link and read the article or make a purchase. Bounce rate is the percentage of people who clicked on the link but were quick enough to exit the page without exploring or taking any action.
Your bounce rate should be low; if it is high, it may indicate that your content isn’t engaging or there is an issue with the user experience on your website.
10. Average Session Duration and Pages Per Session
Average session duration gives context of how much time a user has spent on your website. It is a clear indicator if your content is performing well. Average session duration is a metric available on Google Analytics.
In Google Analytics, go to Audience and select Overview to find your website’s average session duration. You can filter it by channels and see how much time users landing from social media are spending on your website. If the session duration is very low, it’s a clear indication that your content on the website is not engaging enough.
Pages per session is the average number of pages viewed by a user during a given session. You can monitor your pages per session from social media on google analytics. If the pages per session is 1 or 1.5, you need to work on creating interlinks for your webpages.
Conclusion
Social media tracking is an essential component of any social media strategy. And only with the help of social media KPIs, you know how your social media strategy is performing! Also, they give you a clear idea of whether your company goals are being met or not!
For instance, knowing how many comments, shares and likes your posts receive will allow you to track your cumulative post engagement rate. This figure will increase with time as you implement engagement-focused strategies.
So, those are the 10 important social media KPIs you should consider using today! Consistent monitoring and tweaking can help improve the engagement factor and optimize your social media marketing efforts with ease!
That said, get started now! You’ve got work to do
And yes! You can even talk to one of our experts if you need more assistance on this. Or simply a comment below would do!

